Profitability Index
Profitability Index Calculator (Click Here or Scroll Down)

The profitability index formula is used calculate the profitability of a project based on its future discounted returns relative to the initial investment. The PV of future cash flows does not include the initial investment. It only includes the inflows or future returns.
Obviously, an investor wants the present value of future cash flows to be higher than their initial investment. And so, the profitability index should be greater than 1. Keep in mind that if the profitability index is less than 1, this does not necessarily mean that the cash flows will add up to less than the initial outflow. It may only mean that the rate of return is less than the discount rate used when calculating the present value of the cash flows.
For example, using simple terms, suppose an intitial investment of $1,000 with 4 cash flows of $300. If we use a 10% discount rate, the present value of those inflows are $950.96. This PV is less than the initial investment, however the total inflows are $1200. This only means that the rate is less than 10%. It is closer to 7.71%.
In other words, there may be a positive IRR and a payback period, while still having a PI less than 1, and a NPV less than $0. The discount rate is an important part of the profitability index calculation.
Example of the Profitability Index Formula
To use the prior simple example, suppose that an initial investment of $1,000 has 4 equal inflows of $300. As stated, the present value of the future inflows are $950.96. Using these variables, the formula on this particular project is
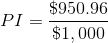
which results in a profitability index of .951. This is lower than the minimum of 1.
Issues with the Profitability Index Formula
The profitability index formula runs into the same problems that the NPV does. It is far simpler to illustrate these issues. Suppose that two investments have a NPV of $1000, but one project is for 3 years and the other is for 5 years. It is easy to see that one would prefer to get their net current value within 3 years than 5 years. Also, this is not a real comparison as there is 2 additional years of using that money, perhaps with a different investment, that isn't added to the NPV and considered.
Often though, it isn't always this simple to see that everything is equal except for the term. What if the 3 year project has an NPV of $1,000 and the 5 year project has an NPV of $1,100. One could annualize these net returns using the equivalent annual annuity formula, for the sake of like comparison.
The profitability index formula uses the same variables as the net present value, and likewise, doesn't annualize the returns.
Benefits of the Profitability Index Formula
It is considered that when NPV is $0+ and the profitability index is 1+, the project is a healthy venture. However, when comparing two positive projects, the NPV does not consider the amount tied up in the investment. To more easily illustrate this, use the extreme example of two projects with both having an NPV of $1,000. But, suppose that one has an initial investment of $1,000 and the other has an initial investment of $1,000,000. It is easy to see now with additional information that the lower upfront amount is far better.
Now, look at these two situations using the profitability index. The lower investment has a PI of 2.00 and the higher investment has a PI of 1.001. The PI formula adds an extra dimension and compares the two ventures in relative terms, where the NPV does not.
Unfortunately, when two different investments have the same PI, this does not tell you which ties up more money initially.
- Formulas related to Profitability Index
- Net Present Value
- Payback Period
- Discounted Payback Period
- Annuity - Present Value
- Equivalent Annual Annuity